Is the Frontline Economy at Risk from AI? What WorkWhile Data Tells Us

Is the Frontline Economy at Risk from AI? What WorkWhile Data Tells Us
The debate over artificial intelligence and jobs tends to center on knowledge workers—lawyers, analysts, coders, and writers. But what about the people who move goods, drive delivery vans, and stock shelves? This post uses WorkWhile platform data to take a first look at where the frontline workforce stands on the AI-exposure spectrum, and why the answer depends on looking at specific tasks, not just broad job titles.
The question everyone is asking (and who is usually left out of the answer)
Over the past two years, a wave of economic research has tried to answer a deceptively simple question: which jobs are most exposed to AI? The headline findings tend to follow a pattern: higher-wage, desk-based occupations—accountants, paralegals, software developers—sit at the top of every exposure ranking, while manual and physical roles appear to be more insulated.
That framing, however, leaves a large slice of the American workforce in the margins. WorkWhile operates in the frontline economy: warehouses, last-mile delivery, food prep, light manufacturing. These are the workers powering the supply chains and service networks that the rest of the economy relies on. They are not the typical protagonist in the AI-and-jobs narrative, but that does not mean they are unaffected.
To get a first data-driven answer, we matched WorkWhile’s shift records to a leading academic AI-exposure benchmark and asked: where does the frontline labor market actually sit on the exposure spectrum?
The benchmark we used: the 𝛽 score
The measure we rely on is called 𝛽 (beta), introduced in the landmark paper by Eloundou et al. “GPTs are GPTs: An Early Look at the Labor Market Impact Potential of Large Language Models” (2023), published in collaboration with OpenAI.
The intuition behind it is straightforward. For each occupation, the authors reviewed the official list of tasks workers are expected to perform using the U.S. government’s O*NET database. Each task was rated against a simple rubric:
- Direct Exposure (E1): Can direct access to a Large Language Model (LLM) cut the time needed to complete this task by at least half, while maintaining equivalent quality? If yes, the task gets a full exposure score of 1.
- Indirect Exposure (E2): If the LLM alone can’t do it, could a specialized software tool built on top of an LLM achieve that 50% time savings? If so, it gets a score of 0.5, reflecting that the capability is technically feasible but requires further engineering and business investment to actually materialize it.
- No Exposure (E0): If AI cannot significantly reduce the task time, it receives a score of 0.
The occupational 𝛽 score is the weighted average of these task scores, resulting in a final value sitting on a 0 to 1 scale. A score of 0 means AI can’t save meaningful time on any of the job’s tasks, while a score of 1 means every single task is directly fully exposed.
For most frontline occupations, day-to-day work is naturally dominated by physical, spatial, or sensory work — driving, lifting, sorting, inspecting — which large language models cannot replicate. Yet, many frontline roles include some information-processing tasks, for instance logging data, reporting issues, and communicating updates. This informational layer, however thin, is what registers on the 𝛽 scale even in otherwise hands-on jobs. Understanding the 𝛽 score for any given frontline occupation is therefore largely a question of how much paperwork sits alongside the physical work.
One important note: 𝛽 measures potential exposure — what AI could plausibly accelerate — not actual adoption. A high exposure score doesn’t mean a job is automated out of existence tomorrow; it means AI tools could act as a significant productivity booster for the administrative segments of that role.
Connecting WorkWhile data to the AI-exposure benchmark
To measure where our workforce sits, we assigned each shift in our platform records to a Standard Occupational Classification (SOC) code, then linked those codes to the 𝛽 scores in the published dataset of Eloundou et al. (2023). We divided all 923 O*NET scored occupations into five equal-sized groups, quintiles, ranging from Q1 (lowest AI exposure) to Q5 (highest). WorkWhile shifts were then placed into whichever group their occupation’s 𝛽 score fell into.
This approach uses the full landscape of U.S. occupations as the reference frame, giving each occupation an equal weight regardless of how many workers it represents. The result tells us not just what WorkWhile’s average exposure is, but where in the national distribution our workforce sits.
Where WorkWhile shifts land on the AI-exposure spectrum
WorkWhile’s workforce is concentrated in the physical economy, roles where the core task is moving, driving, building, preparing, or maintaining something in the real world. Light Truck Drivers, who account for roughly 31% of workers on the platform, are the most notable exception to the fully hands-on pattern, because their role pairs a physical core with a meaningful layer of administrative and communicative work. That split, as we will see, is precisely what makes them the most interesting occupation in this analysis.
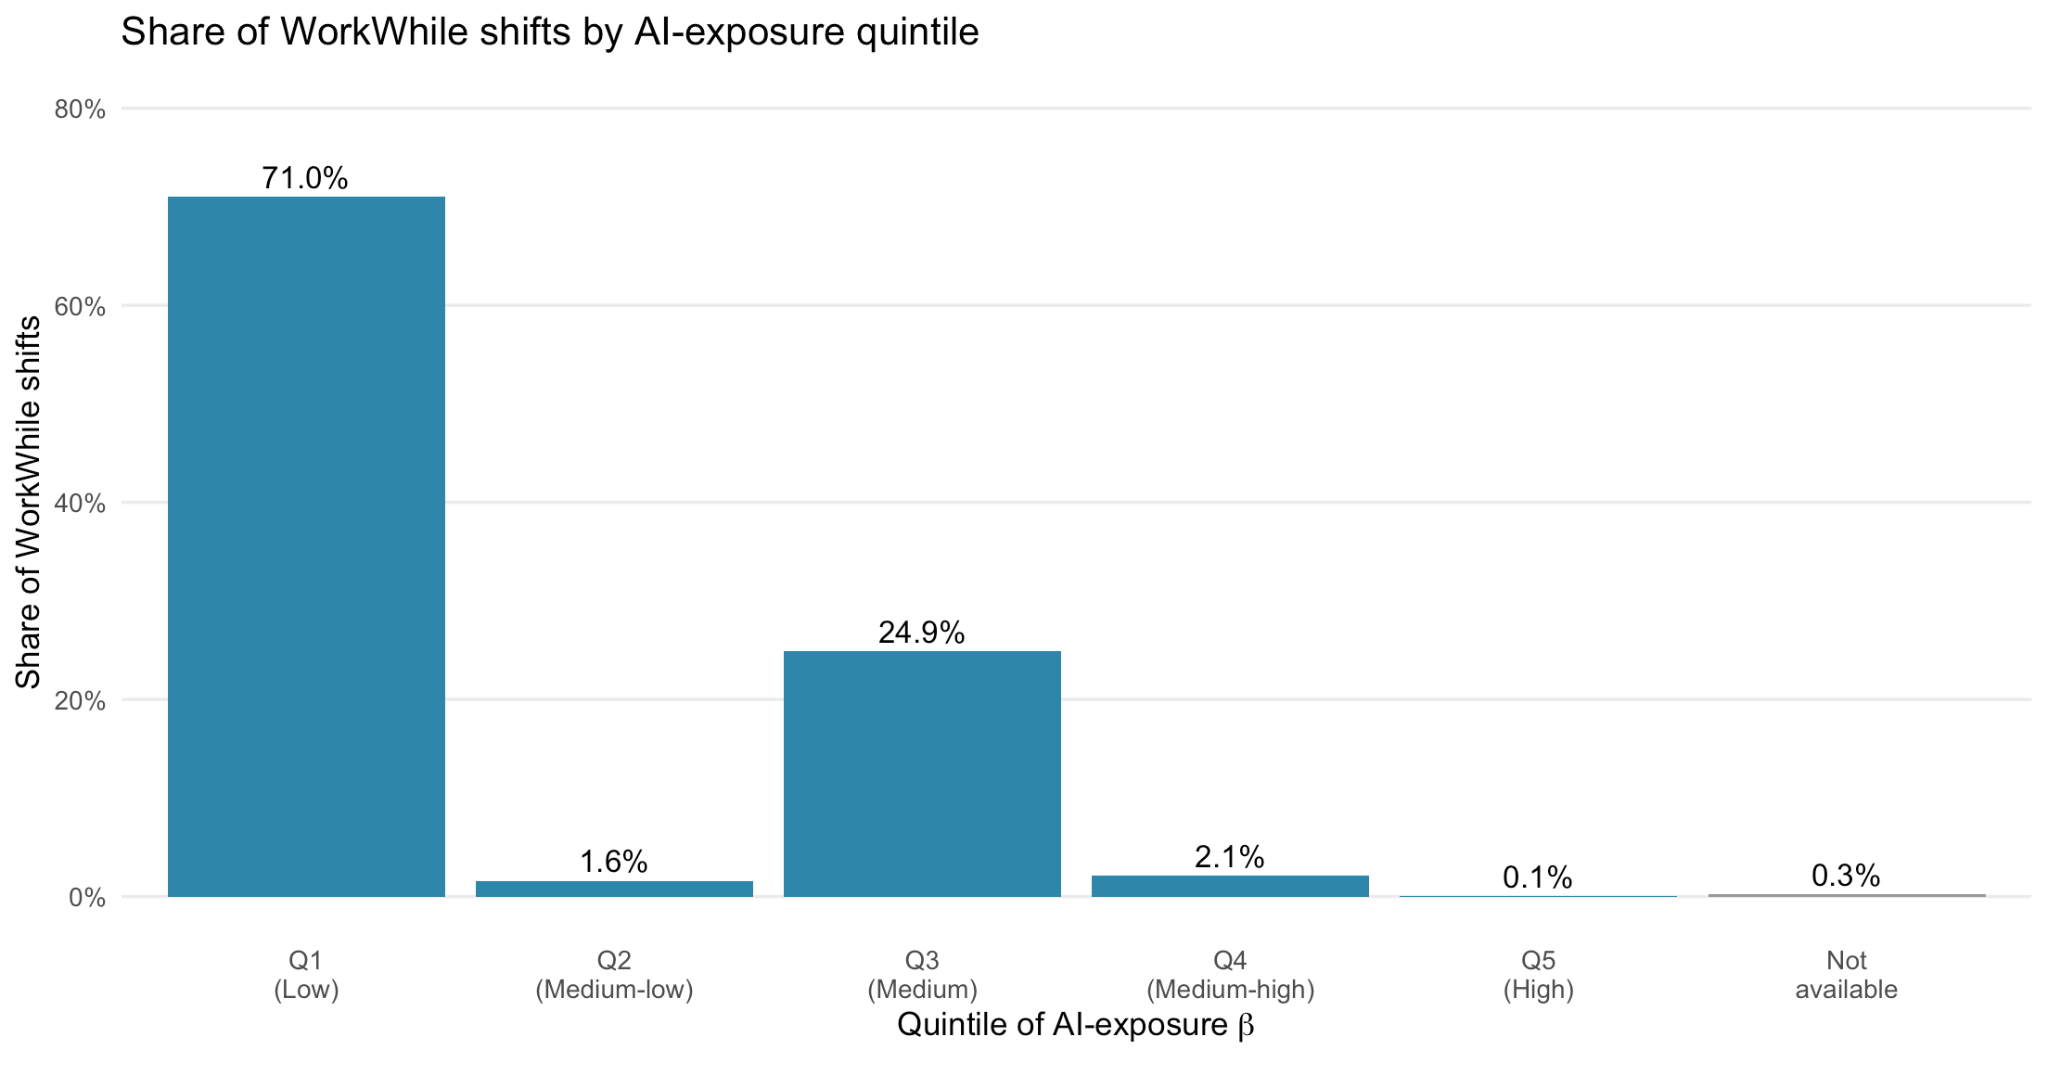
Instead of spreading evenly across the economy, WorkWhile shifts are sharply concentrated at two points on the distribution:
- 71% of all shifts fall in Q1 — the lowest-exposure quintile of the national occupational landscape (𝛽 ≤ 0.11). These are roles whose task portfolios are almost entirely physical in ways that leave no foothold for AI.
- ~25% of shifts fall in Q3, the middle band (𝛽 between 0.28 and 0.43). This cluster is driven almost entirely by Light Truck Drivers — an occupation whose physical core (driving, loading, maintenance) sits firmly in Q1, but whose informational layer (manifests, dispatch reports, billing records, route coordination) pulls the overall score up into the middle of the distribution.
This bimodal split is a direct reflection of the task-composition: purely physical occupations cluster at the bottom, while occupations that mix physical work with a meaningful administrative and communication layer shift upward. The remaining quintiles — Q2, Q4, and Q5 — together hold fewer than 5% of WorkWhile shifts. Q5, the highest-exposure category, is effectively absent; this is where knowledge-intensive occupations live, and it is a labor market segment in which WorkWhile does not operate.
A closer look: the hybrid exposure of Light Truck Drivers
The 𝛽 = 0.37 score for Light Truck Drivers deserves a closer look, because at first glance it seems surprising. Driving a van is not something an LLM can do. So why does this occupation hold a medium AI-exposure score?
The explanation lies in the fact that the 𝛽 score evaluates an occupation’s entire task portfolio. Breaking down the O*NET task inventory for a light truck driver shows that the responsibilities are divided into two distinct buckets: core physical labor and informational workflows. The classification of these tasks below is drawn directly from the rubric established by Eloundou et al. (2023).
The physical tasks where AI can’t compete
Seven out of the thirteen official tasks for this role are rooted firmly in the physical world (Table 1, rows 1–7). Safely navigating a vehicle through live city traffic, loading and unloading cargo, or changing a flat tire have no digital equivalent yet. This heavy physical footprint is what structurally insulates the job from AI-exposure, and it is why driving occupations will not be disrupted by today’s AI in the way that, say, a paralegal or a financial analyst might be.
What drives the 𝛽 score
What pushes the 𝛽 score to 0.37 is the remaining set of tasks that are bureaucratic, communicative, or tied to information processing (row 8-13). These are information-based workflows where AI-powered logistics and tools are incredibly capable. Below is the official O*NET task breakdown for SOC 53-3033.00 mapped against Eloundou et al. (2023)’s AI-exposure classification.
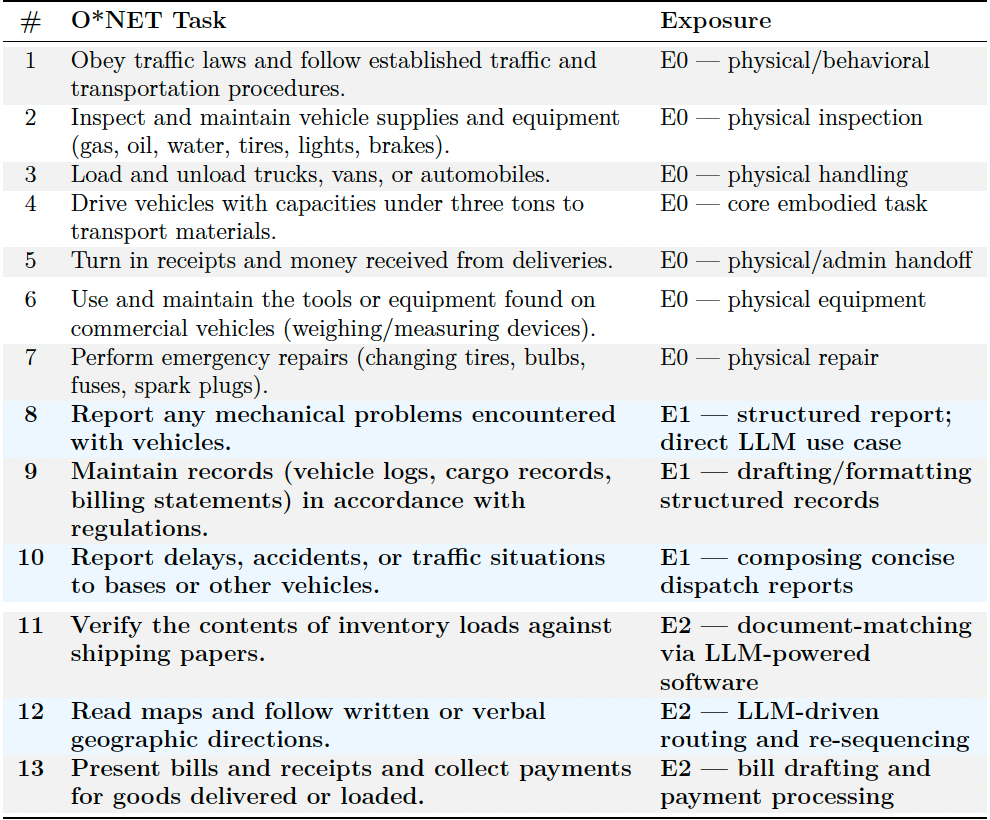
The six E1 and E2 tasks highlight exactly where AI is optimizing logistics : automatically checking cargo manifests to flag missing inventory (Task 11) ; processing customer receipts and invoices (Task 13) ; or drafting concise mechanical delay updates back to dispatch (Tasks 8 and 10). It even applies to next-generation routing software that uses LLM interfaces to adapt delivery sequences instantly based on live traffic data or customer notes, moving far beyond traditional static GPS capabilities (Task 12).
Therefore, a 𝛽 score of 0.37 score means: “37% of a light truck driver’s task portfolio consists of tasks that the use of AI can substantially accelerate”. This insight matters for thinking about what AI exposure actually means for frontline workers. The near-term impact, where it comes, is more likely to look like a productivity assist that reduces administrative burden rather than displacement of jobs.
What this means for the future of shift work
The physical frontline work is broadly insulated from AI displacement. The 71% of WorkWhile shifts sits in the lowest possible exposure quintile and reflects a straightforward reality: some physical work cannot be replaced by AI. This is consistent with the conclusions of Eloundou et al. (2023), who emphasize that AI exposure remains heavily concentrated in high-wage, office-based roles.
Frontline AI-exposure lives entirely in informational tasks. Even in the most hands-on roles, there’s always a layer of communication and recordkeeping running alongside the physical labor. This administrative side is what AI is primed to change. The near-term AI opportunity in logistics isn’t about cutting headcounts, but rather removing operational friction, like reducing the time a worker spends reconciling cargo manifests, logging exceptions, or filing dispatch reports.
WorkWhile’s shift-level data unlocks research possibilities that national surveys simply can’t match. By tracking the frontline shift by shift, WorkWhile platform offers a sharp, real-time look at a workforce that traditional data only captures in broad strokes. Linking these records to academic benchmarks is just the beginning. As the flexible workforce evolves, shift-level analytics will be among the first to capture how modern technology redefines traditional roles. Because this data updates instantly, it can spot these structural workplace shifts long before they ever register in lagging national statistics.
Conclusion
WorkWhile’s data offers an alternative lens to the debate on how AI is impacting the labor market, which so far has been dominated by knowledge work. With 71% of shifts concentrated in the lowest AI-exposure quintile, the frontline workforce is broadly insulated from AI disruption. This is not because these workers are sheltered from technological change, but because the physical tasks performed for their jobs lie beyond what AI can replicate.
Where exposure does exist, as the Light Truck Driver analysis shows, it is anchored in the administrative tasks that exist alongside physical work. For policymakers and businesses alike, this distinction matters: the near-term AI story in the frontline economy is one of administrative productivity gains, and not workforce displacement. With shift-level data that updates in real time, WorkWhile is positioned to track how that story unfolds long before it appears in national employment statistics.
Data and methodology: AI-exposure 𝛽 scores are sourced from Eloundou, Manning, Mishkin & Rock (2023), “GPTs are GPTs: An Early Look at the Labor Market Impact Potential of Large Language Models,” via the OpenAI public data repository. WorkWhile shift records were mapped to Standard Occupational Classification (SOC) codes using a hand-curated internal crosswalk, subsequently linked to the Eloundou dataset using the official BLS 2018-to-ONET 2019 data crosswalk.

