Measuring Real-Time Labor Shortages: The WorkWhile NEED Index

Measuring Real-Time Labor Shortages: The WorkWhile NEED Index
National US labor statistics picture a labor market in equilibrium, a situation where the number of people looking for work roughly matches the number of open jobs, yet sectoral data point to important shortages in construction, skilled trades, logistics and manufacturing. WorkWhile's newly launched NEED index provides a measure of the labor shortages directly from shift-level transactions. Its latest weekly reading, 115, signals Elevated Need of workers, and over the past six years it has anticipated news coverage of labor shortages by three to four months. This post takes a closer look at what the index shows and how it compares with the Federal Reserve Board's news-based Shortage Index.
Three forces behind the shortage
The United States faces binding labor constraints in construction, the skilled trades, logistics and the operation of digital infrastructure, driven by three concurrent forces. The first is a demand shock from the build-out of AI data centers: data-center postings rose from about 2 to about 6 per 1,000 US job postings between mid-2023 and mid-2026, while total postings fell by about 12% [1]. These projects draw electricians, technicians and installation workers away from utilities, manufacturing and logistics, which were already short of workers. The second is replacement demand. The construction sector must attract 349,000 net new workers in 2026 and 456,000 in 2027, mostly to replace retirees; about one in five electricians is over 55 [2]. The third is slower growth of the labor force. The Congressional Budget Office (CBO) estimates that net immigration fell from about 3.5 million in 2023 to about 410,000 in 2025, sharply slowing population and labor-force growth [3]. As a result, the economy now needs only 15,000 to 87,000 new jobs a month to keep unemployment steady [4], so weak hiring numbers can coexist with acute shortages.
Supply cannot adjust quickly, because apprenticeships take almost four years to produce journey-level workers. Supply deficits emerging today are expected to last through the end of the decade and could get worse as the demand for compute power is expected to outpace the planned data centers, and would require an even faster buildout.
Current national statistics do not capture it
National statistics show a balanced labor market. In June 2026 there were 7.4 million job openings and 7.1 million unemployed people, and the ratio of unemployed people per opening has stayed between 1.0 and 1.1 since February 2025 [5]. In July 2026 the openings, hires and quits rates stood at 4.4%, 3.2% and 1.9%, the profile of a low-churn market [6].
The sectoral data tell a different story, and this is how we know the shortages are sectoral. Construction openings reached 326,000 in July 2026, up from 305,000 a year earlier, raising the sector's openings rate from 3.6% to 3.8% while total openings were flat [7]. Durable-goods manufacturing posted an opening rate of 5.2%, against 4.4% for all industries [6]. Official statistics, however, are monthly, published with a lag, and count openings, which reflect hiring intentions rather than whether positions are filled. Policy aimed at sectoral shortages needs a measure that is high-frequency, granular by sector and region, and grounded in realized transactions.
Measuring labor shortages in real time: the NEED index
A labor shortage is demand at the prevailing wage that available supply does not meet. WorkWhile operates a marketplace for flexible hourly shifts in frontline sectors including Warehouse and Production, Delivery, Hospitality, Events, and Merchandising and Inventory. It observes both sides of that market at the transaction level: every shift an employer requests, whether and how quickly a worker claims it, and the total wage needed to fill it.
The raw marketplace data already shows tightening. Over the past 90 days, requested shifts rose 53%. However, both the schedule rate (the share of requested slots signed up for) and the fill rate (the share actually worked) decreased. Volumes partly reflect platform growth, as employers posting shifts rose 11% and active workers 30%, but the ratios are independent of scale. Their decline indicates that worker supply is not keeping pace with employer demand.
The NEED index (National Employment & Elasticity Deficit), which WorkWhile launched this week, provides a live, real-time pulse of labor shortage across 1.4 million frontline workers. It is computed weekly from three components: the Unmet Headcount Deficit, the share of requested hours that go unfilled; Supply-Constrained Fill Time, how long shifts take to fill; and the Clearing Wage Premium, how far pay must rise above the posted rate for shifts to clear. The index is a weighted average of the standardized components, rescaled so that 100 corresponds to the balanced market state and a uniform one-standard-deviation increase in all three components raises the index by 10 points. Readings between 90 and 110 indicate balance; 110 to 140 indicate Elevated Need of workers, where shift fill times roughly double and surge premiums become necessary; and readings above 140 indicate Acute Need, where even aggressive surge pay fails to fill shifts. NEED complements general labor utilization and wage growth indices including WorkWhile's ALUR, which measures supply-side slack, and RISE, which tracks frontline wage growth.
What the NEED index shows today
In the week of October 12, 2026, the national NEED index stood at 115, in the Elevated Need band and 15 points above balance, down from 120 the previous week (Figure 1). Apart from specific episodes in 2021 and 2025, the index has fluctuated mostly within the balanced band; the rise that began in mid-2026 is the first sustained move into Elevated Need since then.
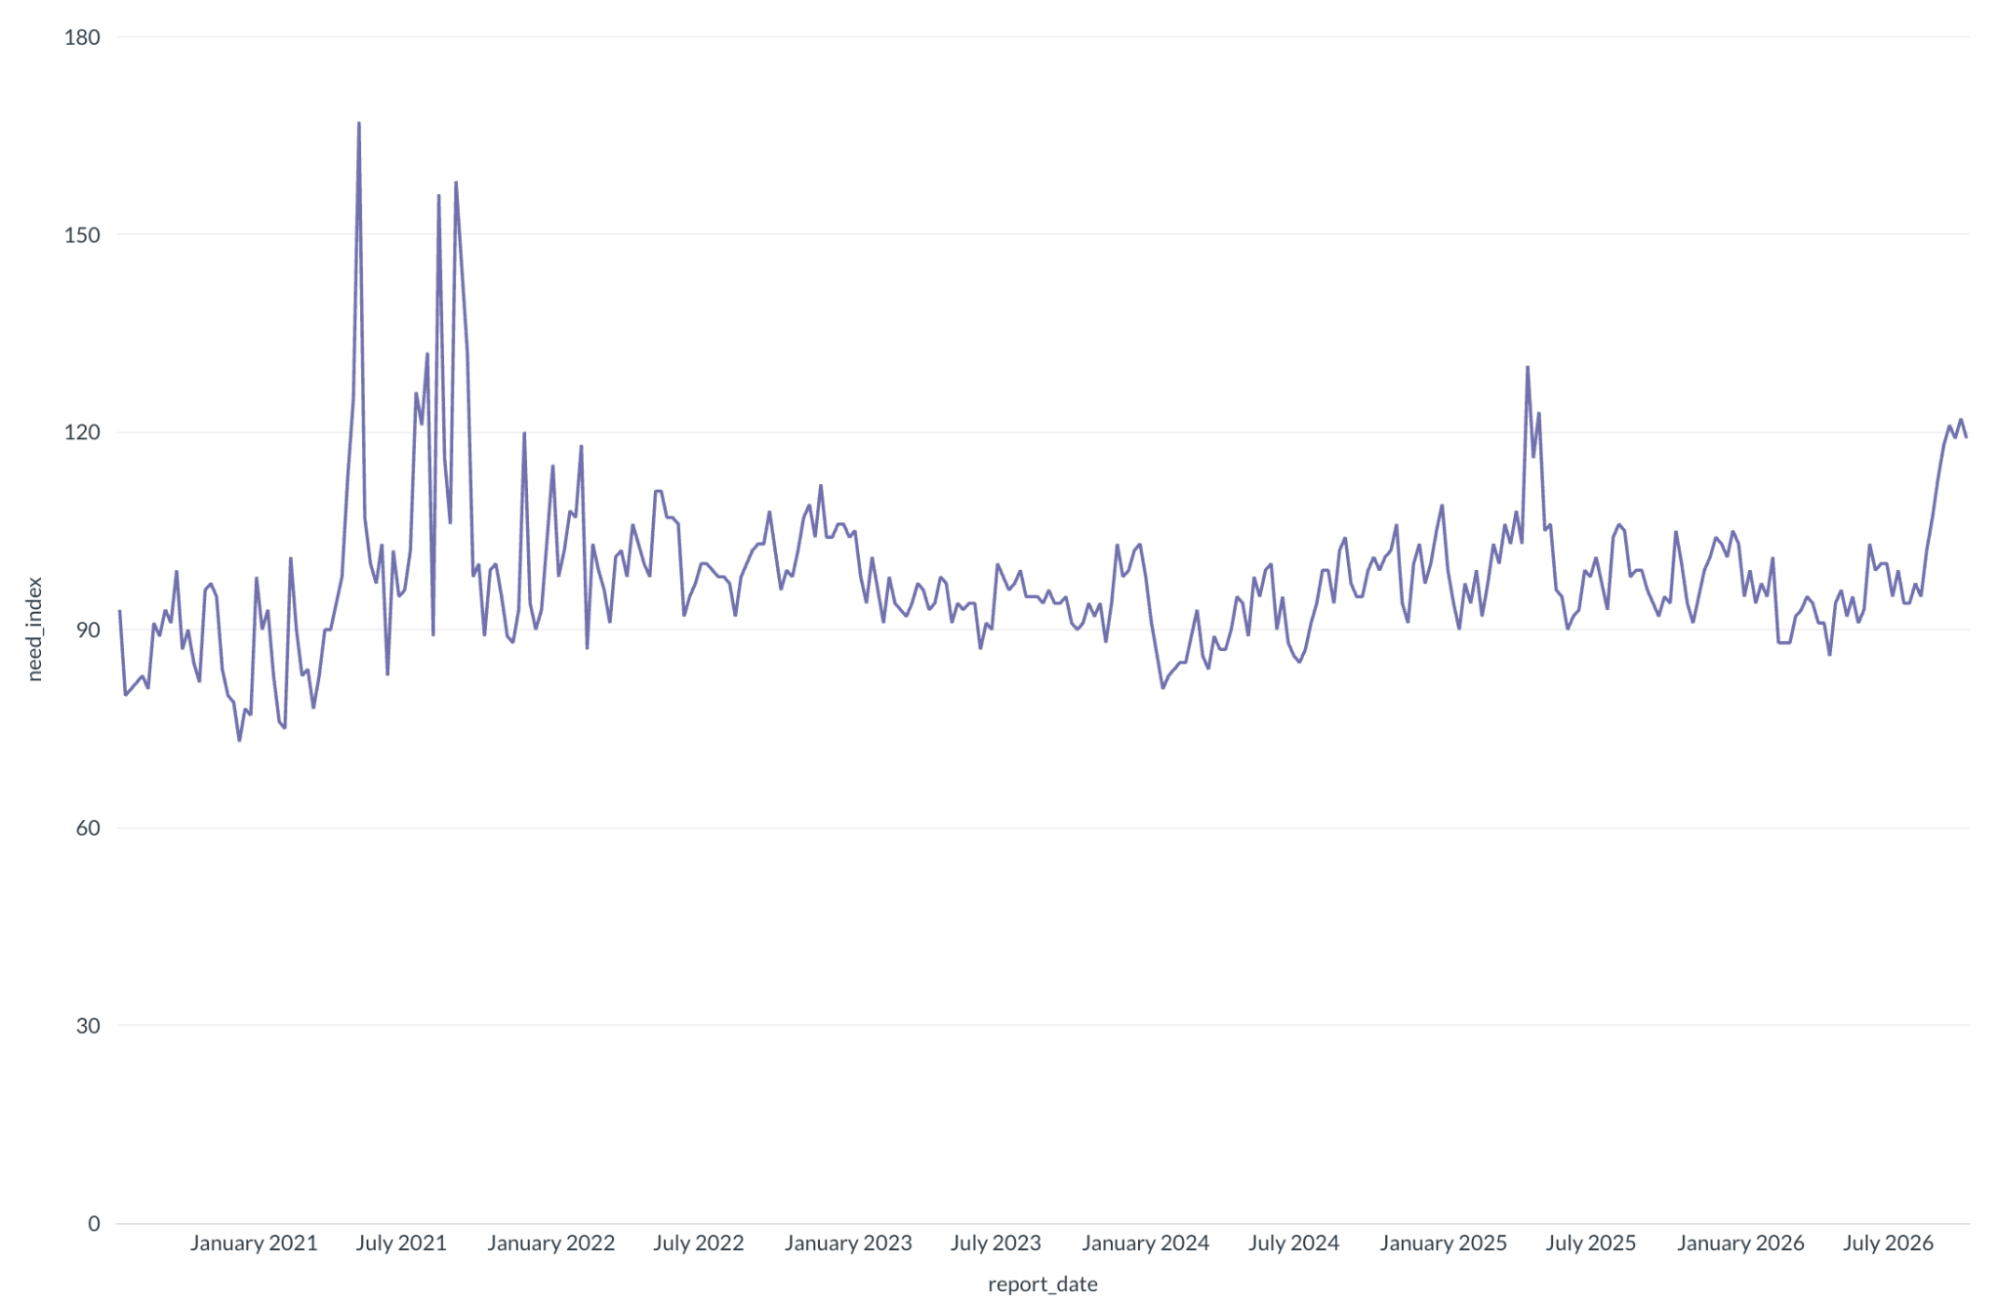
The national figure masks marked regional differences. The South shows the greatest tightness, at 122, and the Northeast stands at 115, both in Elevated Need. The Midwest, at 108, sits at the upper edge of the balanced band, while the West, at 96, remains balanced. Weekly series for each region can be explored on the NEED index page.
The NEED index and the Federal Reserve's Shortage Index
A widely cited recent measure of US labor shortages, referred to below as the Shortage Index, is the news-based index developed at the Federal Reserve Board by Caldara, Iacoviello and Yu [8][9]. Each month it counts the number of articles in the six major US newspapers that discuss a shortage. The analysis below is based on the labor component of this index.
While both the Shortage Index and the NEED index measure labor shortage, they inevitably carry different interpretations due to the difference in underlying methodologies. The labor component of the Shortage Index measures related press attention. The NEED index measures the severity of an actual marketplace-based scarcity: the index accounts for the share of requested work that goes unfilled, how long shifts take to fill, and the wage premium needed to fill them. The comparison aims to check whether the actual shortages captured by NEED match those that make the news.
Because the Shortage Index is published monthly, the NEED index discussed in what follows is computed at a monthly frequency. The monthly series is distinct from the weekly index reported above. The weekly reading of 115 reflects the most recent week, whereas the monthly value of 108 for September 2026 averages conditions over a full month and therefore smooths week-level spikes. The two figures are not expected to match.
For meaningful comparisons, the Shortage Index is expressed in log-scale and both indices are standardized. The comparison uses 73 monthly observations from September 2020 to September 2026 to study how the two series move together. We compute Pearson and rank correlations in levels and also in 12-month changes, which remove trends and seasonality. We also compute lead–lag correlations of NEED in month t with the news index in month t + k, for k from −6 to +6, and correlations split at January 2023.

Over the full sample the two series are moderately and significantly correlated: 0.38 in levels (p = 0.005) and 0.51 in 12-month changes (p < 0.001). Both series registered the 2021–2022 shortage episode, but NEED moved first. NEED jumped in May–June 2021, reaching its sample peak of 128 in June 2021, and rose again in September–October 2021. News coverage climbed steadily to its own peak in January 2022, at the height of the “Great Resignation” stories. Since then, the shortages measured by NEED do not seem to have drawn media attention, despite their evident severity. This illustrates the usefulness of marketplace-based measures relative to textual analysis of publications.

The NEED/Shortage Index lead–lag pattern confirms this ordering. Correlations are low when the Shortage Index leads and higher when NEED leads. The basic message conveyed by these correlations is that NEED anticipates the shortages that attract news coverage three months ahead. Again, real and evident labor shortages may seem to have escaped news attention post 2023.
The comparison supports a key conclusion. NEED identifies factual national labor-market shocks, and does so three to four months before they register in the press.
Scope and conclusion
NEED covers the hourly, flexible-shift segment of the frontline labor market, and its employer mix changes as the platform grows. It is therefore best read as an early, granular complement to JOLTS rather than a substitute, and the comparison with the Shortage Index establishes co-movement and timing rather than causation. Within these limits, NEED offers what official statistics cannot: a high-frequency, transaction-based reading of where and how severely employers are struggling to find workers. National and regional readings, published since the index’s launch on October 13, 2026, are available in the WorkWhile Econ Lab and on the NEED index page.
Methodology note: NEED is a proprietary WorkWhile indicator computed on weekly rolling windows from shift-level marketplace data; details are available on the NEED index page.
References
- Indeed Hiring Lab (2026). “Hiring for the Data Center Build-Out.” July 14.
- Associated Builders and Contractors (2026). “Construction Industry Must Attract 349,000 Workers in 2026 Despite Macroeconomic Headwinds.” January 15.
- Congressional Budget Office (2026). The Demographic Outlook: 2026 to 2056. January.
- Bick, A. (2026). “Breakeven Employment Growth: Estimate Range Widens in 2026.” Federal Reserve Bank of St. Louis, On the Economy, March 24.
- US Bureau of Labor Statistics (2026). “1.0 Unemployed Person per Job Opening in June 2026.” The Economics Daily.
- US Bureau of Labor Statistics (2026). “Job Openings and Labor Turnover Summary, July 2026.” September 1.
- National Association of Home Builders (2026). “Number of Open Construction Sector Positions Rising.” Eye on Housing, September.
- Caldara, D., M. Iacoviello and D. Yu (2026). “Measuring Shortages since 1900.” Working paper, March.
- Board of Governors of the Federal Reserve System (2026). “A News-Based Approach to Measuring Shortages and Their Effects on the Global Economy.” FEDS Notes, June 26.

